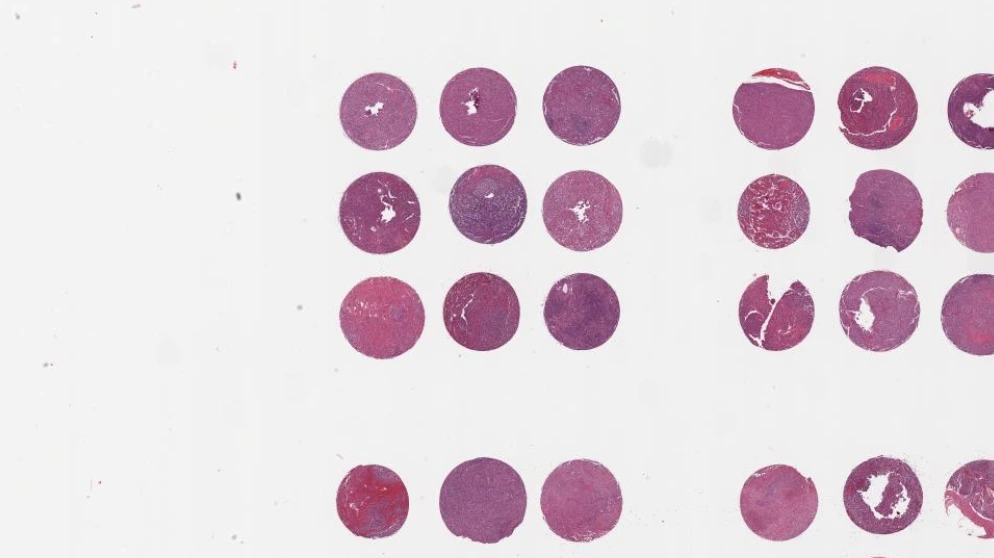
An open-source web app that de-arrays tissue microarrays in the browser: it finds every core, rebuilds the grid, and exports the map, with no install and no upload.
Try it: de-array this slide
This is the real TMA-Grid app running on this page. It opens with the app's own built-in demo slide: an H&E Hamamatsu tissue microarray from the app's public bucket. No slide from the paper's study set is shown here.
Loading the real app and its demo slide. The first load fetches the segmentation model and the slide itself, so it can take a minute on a slow connection.
Open the full app at episphere.github.io/tma-grid
- The slide is already there. The app loads its demo slide on its own and moves to the Segment stage.
- Find the cores. In the Segment stage, press Apply (open the collapsed menu at the top of the Segment stage first if you cannot see it). The presets (default, dense, sparse, damaged, noisy) and the sensitivity slider are live. After Apply, the line under the image shows real counts: Detected / Rescued / Removed artifacts / Recentered. Click the image to add a core, shift-click a core to remove one.
- Fix one core. Press Proceed to the Grid stage, then press Apply in the Grid stage to build the grid. The Review Queue flags problem cores: click an issue in the queue and the viewer flies to that core. Drag a core to move it, shift-click it to toggle it between real and imaginary. The grid rebuilds on the edit.
- See the virtual grid. Press Proceed to the Export stage. Each cell is addressed by its row and column. Click a cell to edit its metadata.
- Download the map. Export the de-arraying table as CSV or JSON from the virtual grid: the map that links every core position to its patient metadata.
- Want your own slide? The full app takes your own .svs, .tif/.tiff, and .ndpi images, read in place with nothing uploaded to a server: episphere.github.io/tma-grid.
Provenance: TMA-Grid is open source under the MIT license. The app above is a self-hosted copy of github.com/episphere/tma-grid at commit f7ed551645f52f51dbe0c11e9e97d3c88ed90035, carried in this site at /projects/tma-grid/app/, unmodified.
TMA-Grid de-arrays tissue microarrays entirely in the browser. A U-Net style neural network (TensorFlow.js) segments the cores, OpenCV.js turns the mask into detections, and Delaunay triangulation plus a traveling row-building algorithm assigns row and column positions, inserting imaginary cores for missing positions. A review queue flags problem cores (missing, misaligned, damaged, marker), and the de-arraying table exports as JSON or CSV.
Results
From the paper: segmentation AUC 0.966 across 10-fold cross-validation on 121 TMA whole slide images; segmentation runs in about half a second; grid accuracy 1.00 on 9 of 10 head-to-head slides against QuPath, and 0.94 on the hardest slide. Paper: DOI 10.1186/s12859-026-06638-2, BMC Bioinformatics 2026. Live app: episphere.github.io/tma-grid. Code (MIT): github.com/episphere/tma-grid. Tutorial: youtu.be/miajqyw4BVk.